Context and preamble
During the 2020 COVID-19 pandemic the slowdown of human activities caused a lot of effects. One of the most discussed was the reduction of the environmental pollution in multiple countries.
(Small disclaimer: I will not mention socioeconomic consequences of the COVID pandemic, I’m no economist and I don’t have the tools to discuss these aspects)
Also in Italy positive environmental effects were observed: from February to May in many cities pollution dropped, and we have all read news on Venice with clear water and of animals roaming in deserted cities.
One thing that impressed me is a video showing the reduction of nitrogen dioxide (NO2), measured by an ESA satellite. The drop of this pollutant (mostly produced by urban traffic) is especially evident in the Pianura Padana, an area of Italy heavily polluted due to its enclosed geographical situation.
After I saw this video I asked myself if it would be possible to obtain a similar visualization (or even a more detailed one, for multiple pollutants) using not satellite data, but the air quality measurement ground stations scattered on the whole Italian territory.
Lots of stations, no common entrypoint
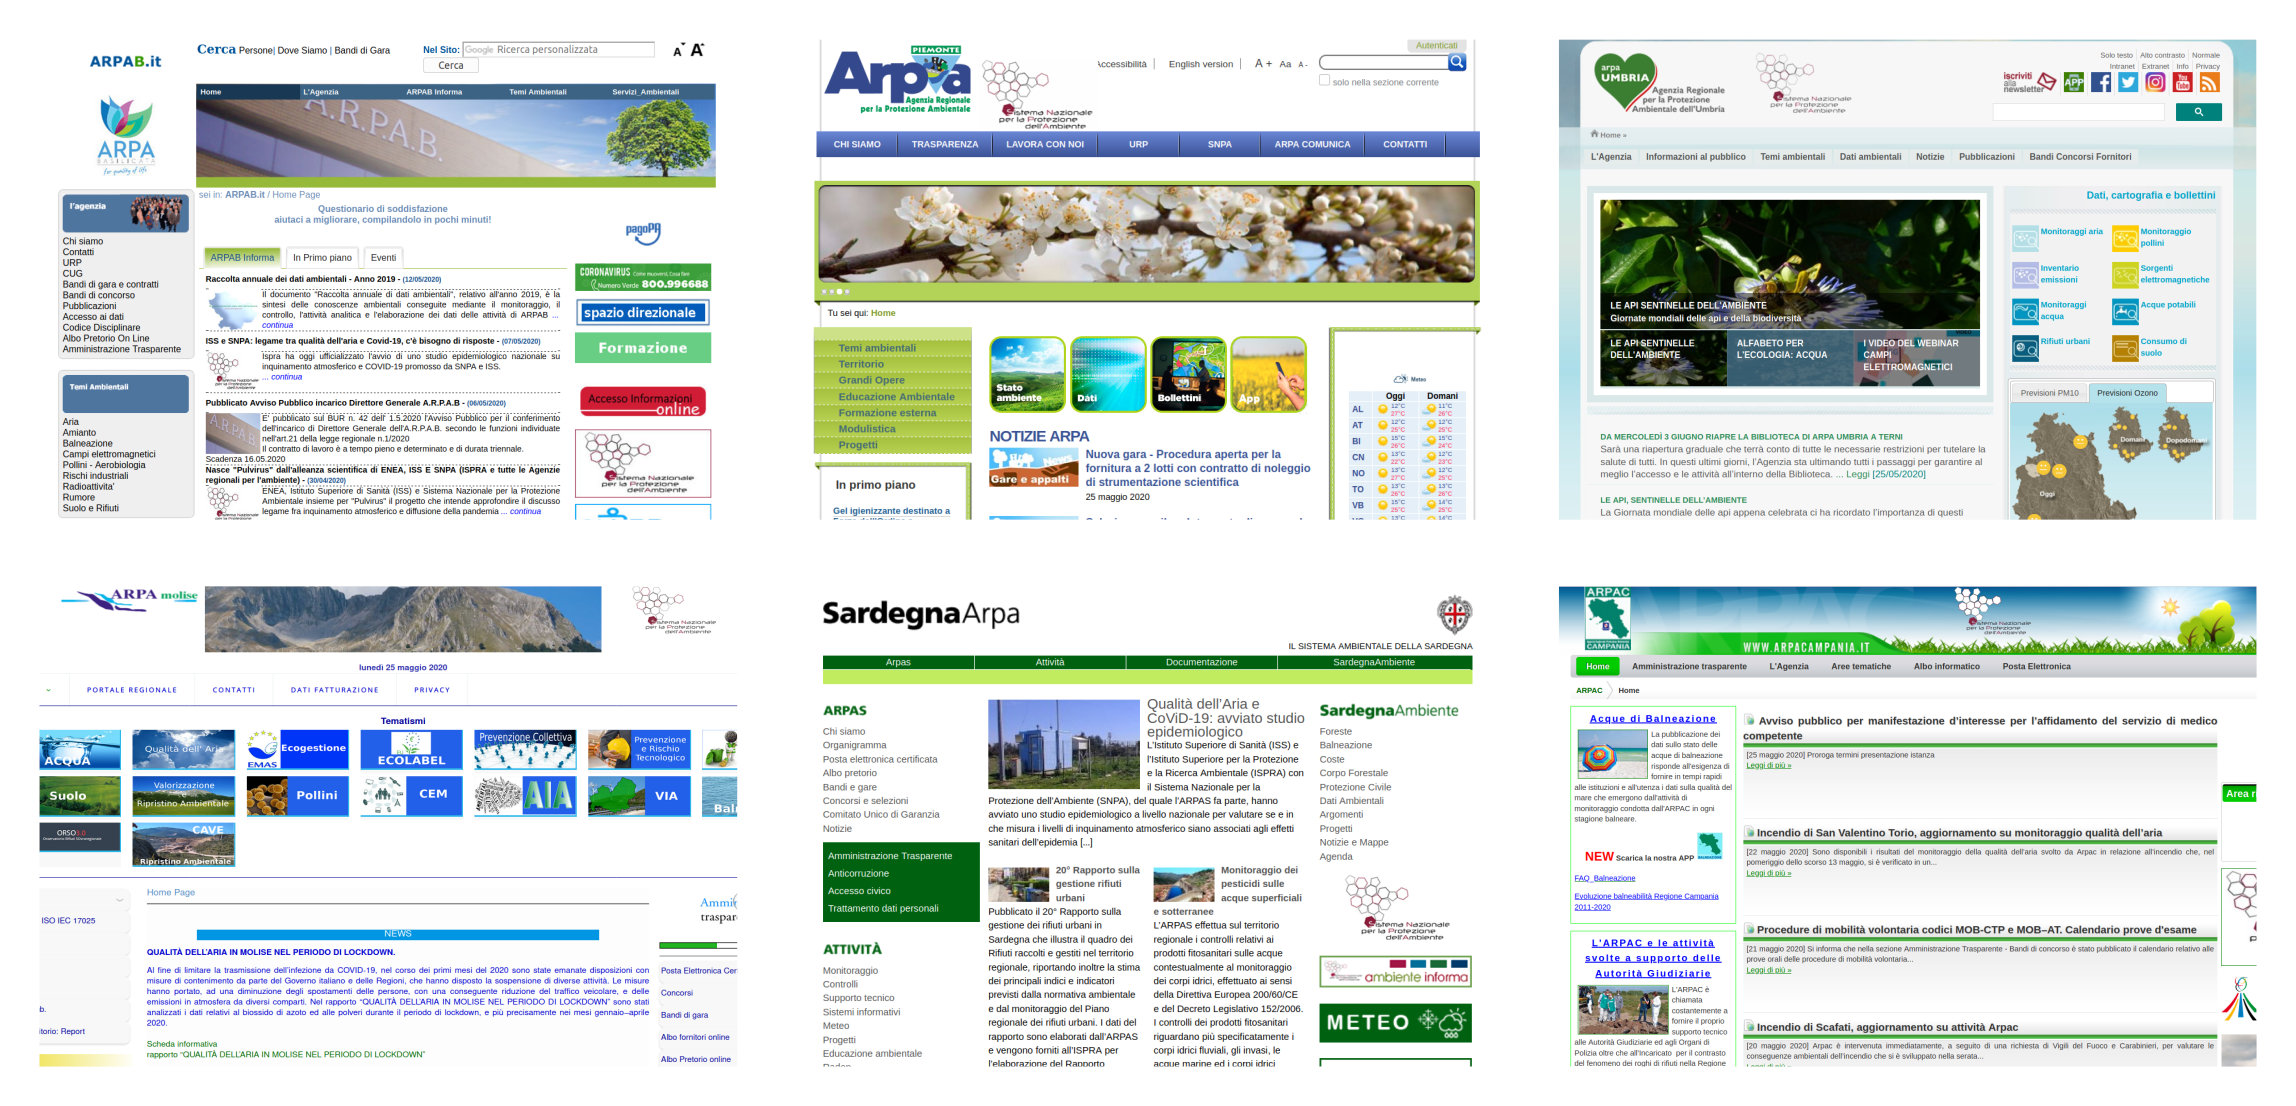
The biggest problem is that every Italian region (and there are 20) has a slightly “different version” of the same environmental agency in charge of pollution measurement. These agencies are all called ARPA, but unfortunately they don’t distribute data in an uniform way.
Even the websites are all different and provide data in multiple diverse formats. For some regions, no APIs are available, meaning that in order to collect information manual data collection may be the only way.

Introducing ITAQA (ITaly Air Quality Aggregator)
This idea led to the creation of ITAQA, a collection of tools able to collect, aggregate and visualize air quality data, unifying the measurements from different cities and regions in a single location.

Data flow and process description
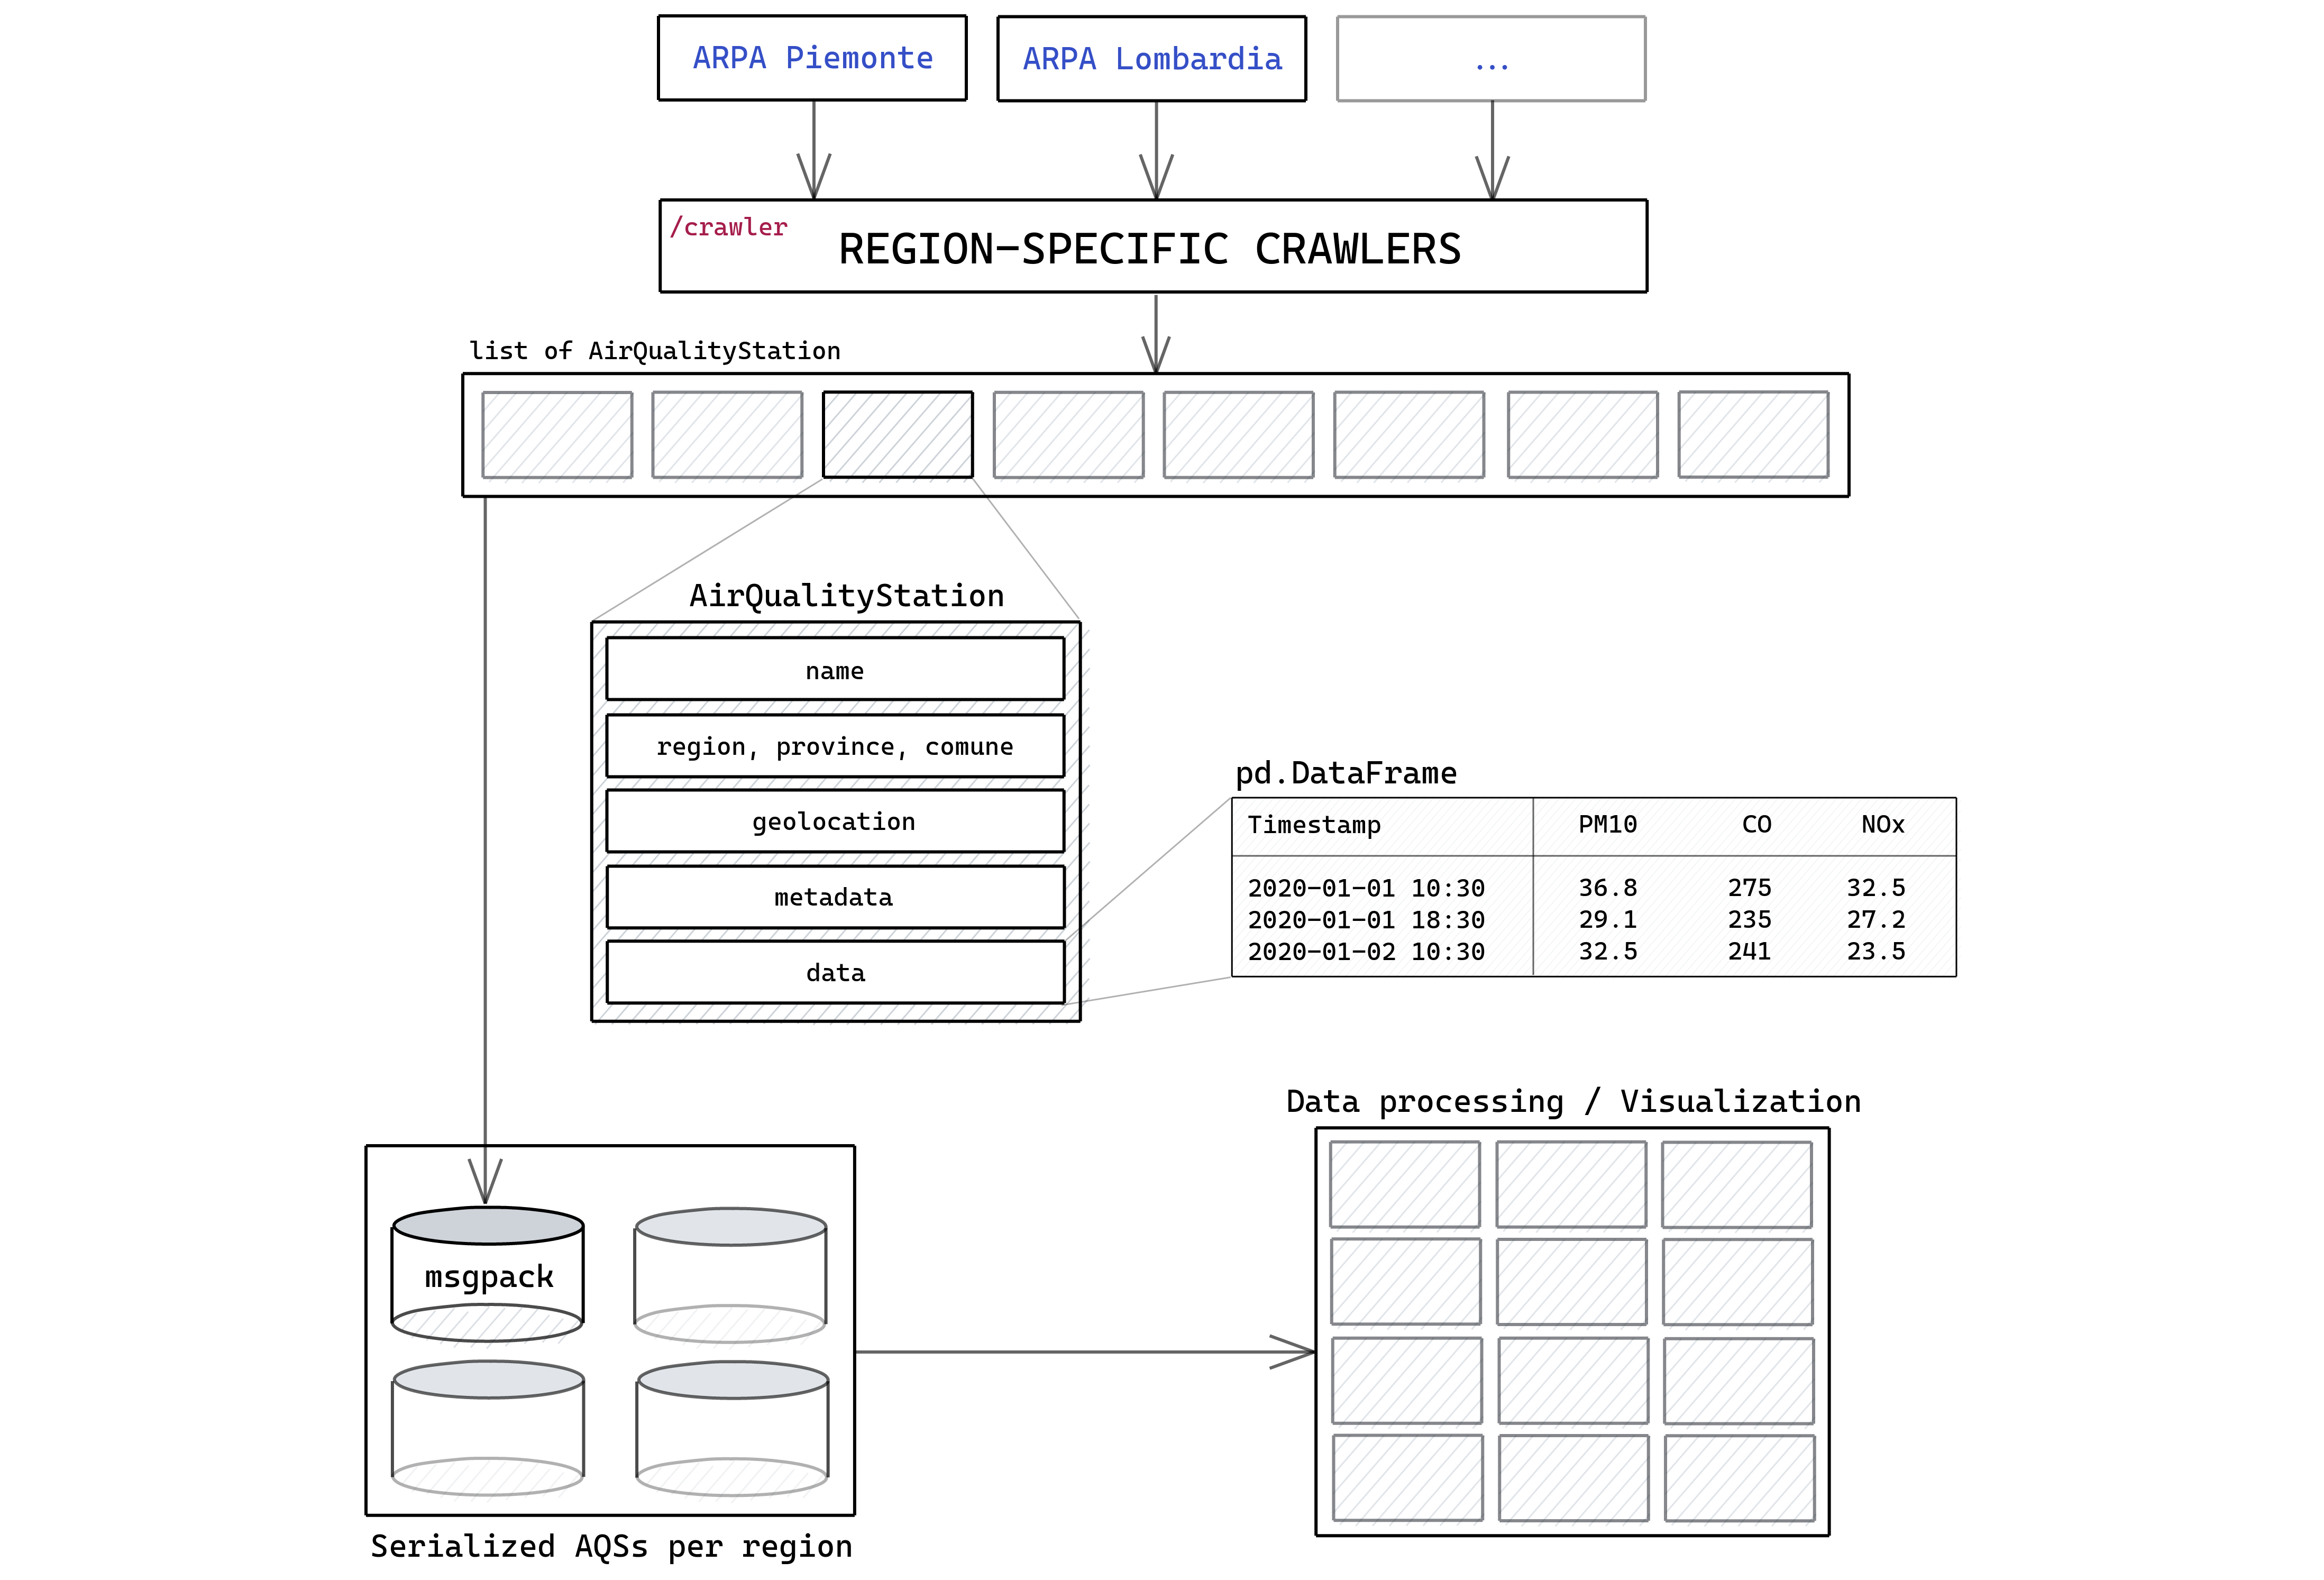
At the current state, the data collection process is the following:
- Multiple crawlers are executed, scripts that automatically obtain and process pollution records from ARPA websites, parsing them into common data structures (
AirQualityStationobjects, or simplyAQS) AQSobject lists are serialized and saved, in order to reload them later on, avoiding the repetition of the previous step- Unified data is processed through visualization and analysis modules, to create graphs, interactive maps and tables
Architecture

What are the results?
The first thing I have in mind is to create a graph for every region that shows the changes in air quality, correlating them to the different “lockdown levels” enforced due to the pandemic. Most likely the reduction of people movements (less people using cars, more remote working, no vacations) led to an evident drop in pollution. I would like to measure in detail this reduction and check if happened in an uniform way over the entire country.
This is already an interesting result, but more can be done.
Having a single place where air quality data for the whole country is organized at a single town resolution (and including geographical coordinates of every sensor) means that a large varieties of correlations can be verified in an immediate way, just adding modules for data aggregation and visualization.
Prove conjectures
The lockdown of these months is a defined and well characterized time frame, for which conjectures and considerations can be made and then verified using ITAQA.
To make some sample conjectures (simplified and maybe completely wrong):
- Nitrogen oxides (NOX) decreased significantly due to the reduction of people moving, instead carbon monoxide (CO) didn’t varied a lot because people at home used more domestic heating systems
- Coastal cities decreased the pollutant levels faster compared to hinterland ones
- Pollution decrease and city size are proportional
Consideration on the main purpose of the project
Similar analysis (measurement of drop in pollution during the lockdown) were already made by others, also by the same ARPAs. Most likely the results obtained by ITAQA won’t be anything new. That being said:
- I enjoy to work on this project
- I’m quite certain that an unique place where data from all Italian regions, with a single sensor resolution, is collected and unified isn’t existing (not publicly, at least)
- The entire project requires multiple technical decisions that are interesting to address and is a nice long-term coding/architectural exercise
Current state
The framework is developed in Python and is currently incomplete: only one crawler is fully implemented (but to improve) and able to generate a list of AQS.
Generally speaking the “skeleton” is done, although a lot of things are missing, like the visualization modules. I’m working sporadically on the project but I hope to produce soon the first results.
The things that will take quite some time will be the implementation of the crawlers: due to the differences in ARPA websites, an ad-hoc solution needs to be adopted for every region. In some particular cases the only way to collect data will be the direct parsing of embedded tables in web pages (using a library like beautifulsoup)
Coming soon
I will talk about the technical part in the next posts. Anyway, the entire project is completely open-source and available to anyone curious: ITAQA-air-quality-aggregator
Possible topics for the next posts, without a specific order:
- Common objects (
AQS),pandas.DataFrameas data structure - Pollutants and air quality indicators overview
- Lombardia crawler, correlation between nearby stations and data processing
- Serialization/encodng (“how do I store lots of information in a compact/lightweight structure?”)
Thanks for reading! :)